
What is a golden cross in trading and why do traders rely on it for bullish signals? A golden cross in trading is a key chart pattern where a short-term moving average crosses above a long-term moving average, indicating potential upward momentum. This signal often marks a shift in market sentiment from bearish to bullish triggering new buying interest across markets.
If you’ve ever missed a big market move, understanding this pattern could be your edge. In this article, Vietnam-UStrade breaks down what makes the golden cross powerful, how to spot it, and how to use it effectively in your strategy.
1. What is a golden cross in trading?
A Golden Cross occurs when the 50-day moving average (short-term trend) crosses above the 200-day moving average (long-term trend) on a price chart. This crossover indicates that recent prices are rising faster than longer-term prices, suggesting increasing buying momentum. Traders view it as a bullish sign, encouraging buying positions.
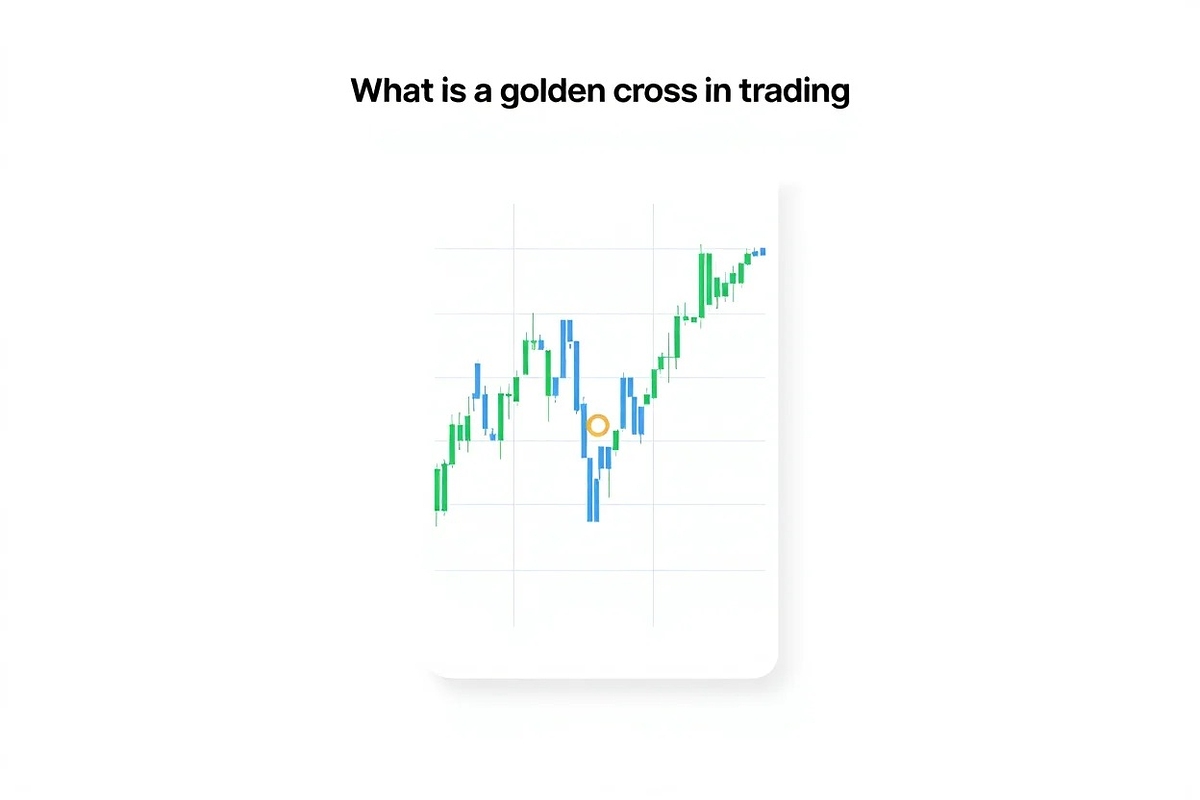
The pattern applies not just to stocks but also to currencies, commodities, and cryptocurrencies. For example, in the context of forex trading, a Golden Cross can signal strengthening in a currency pair. Visualizing this, you’d see the faster 50-day line climbing up through the slower 200-day line, marking a shift from a downtrend or sideways price action toward a potential uptrend.
Key points:
- Short-term moving average crosses above long-term moving average
- Indicates a bullish market signal
- Used across different markets: stocks, forex, crypto, commodities
1.1 Key components of what is a golden cross in trading
The Golden Cross consists of three main parts, each playing a specific role in the pattern’s formation and interpretation.
| Component | Typical Value | Function |
|---|---|---|
| Short-term MA | 50-day MA | Tracks intermediate trend |
| Long-term MA | 200-day MA | Tracks macro trend |
| Crossover | 50-day MA crosses above 200-day MA | Generates bullish signal |
The golden cross is also relevant for those exploring what is bitcoin trading when applying moving average strategies.
1.2 How does the golden cross form?
The Golden Cross usually forms in a few clear steps, these steps form the basic foundation of what is a golden cross in trading, making it a reliable bullish signal when conditions align.
- End of a downtrend: Prices have been falling or moving sideways.
- Bottoming out: The market finds support and starts to stabilize.
- Rising prices: Buying interest grows, causing short-term prices to climb.
- Short-term MA crosses above long-term MA: The 50-day moving average crosses upwards through the 200-day moving average.
- Uptrend confirmation: Prices continue rising, supported by the moving averages acting as dynamic support levels.
Imagine a stock trading around $50 for months. As momentum builds, the 50-day MA rises from below $50 to cross above the 200-day MA sitting near $52. This crossover signals rising optimism and often leads to price increases in the following weeks.
1.3 Interpreting the golden cross signal
Interpreting what is a golden cross in trading accurately can help traders distinguish between real momentum shifts and short-term noise.
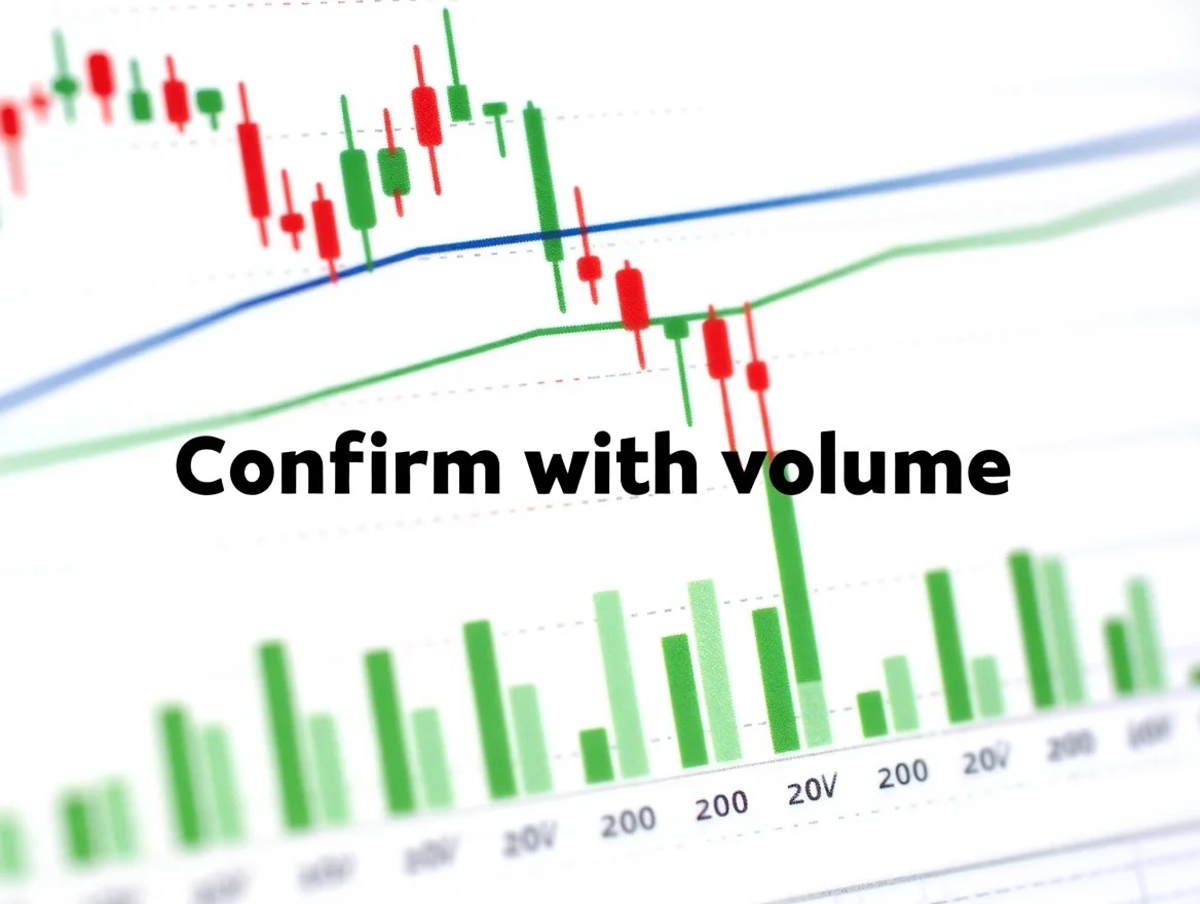
When the Golden Cross appears, traders interpret it as a sign of growing bullish sentiment. Market psychology shifts, prompting more buyers to enter. Typically, after the crossover, price and volume increase together, reinforcing the strength of the signal. Higher trading volume around the crossover adds credibility, showing genuine interest behind the move rather than a temporary spike.
For example, after the S&P 500 generated a Golden Cross in mid-2020, the index saw a steady price rise, supported by increased trading volume. This pattern often encourages trend-following traders to open or add to long positions.
1.4 Phases of the golden cross formation
The Golden Cross develops through three main phases:
- Pre-crossover: The market consolidates and begins to form a bottom after a decline.
- Crossover event: The 50-day MA moves above the 200-day MA, capturing the market’s attention.
- Post-crossover/uptrend: An upward trend starts, with moving averages often acting as support levels during pullbacks.
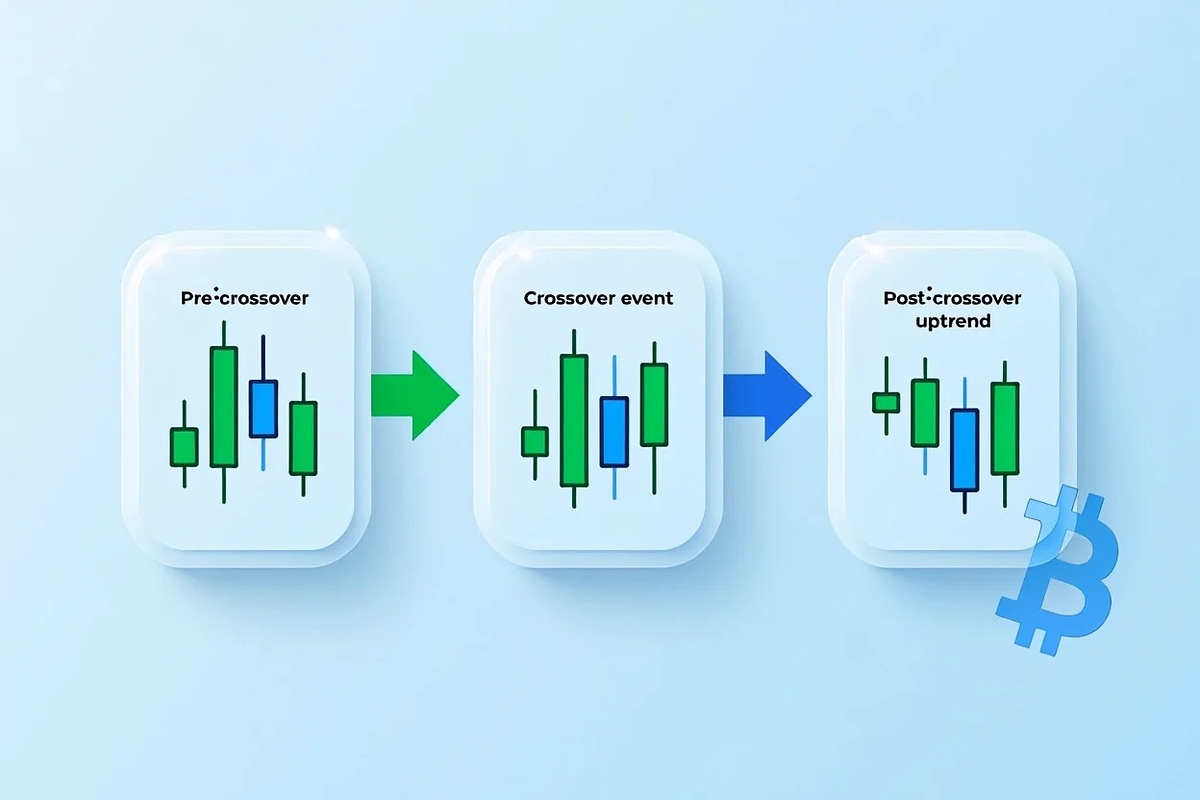
For instance, a cryptocurrency might trade flat for weeks before the short-term average finally crosses the long-term one, sparking a new wave of buying. Recognizing these stages helps traders anticipate changes and prepare entries.
2. How to identify and use a golden cross in trading
Before applying it effectively, it’s important to fully understand what is a golden cross in trading and how it behaves in different markets.
Spotting a Golden Cross involves observing moving averages on your charting platform. Here’s how to identify and apply it:
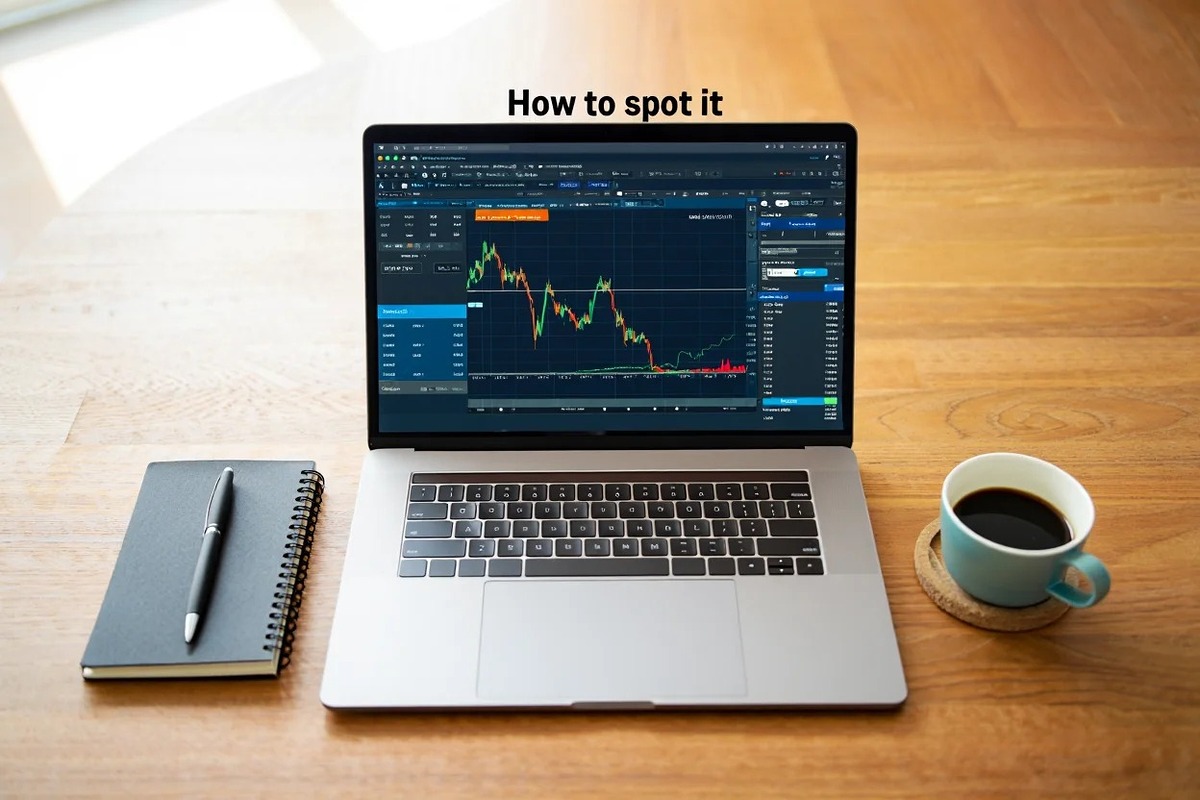
- Choose the timeframe: Daily charts are common for medium-term trades, while weekly or intraday charts can suit longer or shorter strategies.
- Set moving averages: Add a 50-period moving average and a 200-period moving average to your chart.
- Watch for the crossover: When the 50 MA crosses above the 200 MA, note the price and volume behavior.
- Entry strategy: Consider buying near the crossover point or waiting for confirmation with an increase in volume or follow-up price strength.
- Exit strategy: Plan to sell at key resistance levels, upon a reversing moving average crossover, or when other indicators signal weakening momentum.
- Risk management: Use stop-loss orders below recent support to limit losses if the trend fails.
| Step | Action | Example |
|---|---|---|
| 1 | Set 50 and 200 MA | On daily chart of EUR/USD |
| 2 | Wait for crossover | 50-day above 200-day moving average |
| 3 | Confirm volume increase | Higher trading volume on crossover day |
| 4 | Enter trade | Buy near crossover with stop-loss below support |
This approach applies to stocks, forex pairs, and cryptocurrencies alike, giving traders a disciplined way to follow emerging uptrends.
3. Limitations and risks of the golden cross
The Golden Cross is a lagging indicator. It signals a trend change only after price momentum has already shifted. This delay can result in missed early moves or late entries. False signals, known as “whipsaws,” often occur in volatile or sideways markets, where moving averages cross but prices quickly reverse. While what is a golden cross in trading may appear simple, using it without confirmation tools can lead to poor timing.
To reduce risk, traders should combine the Golden Cross with other indicators such as the Relative Strength Index (RSI) or the Moving Average Convergence Divergence (MACD) for confirmation. For example, a Golden Cross paired with RSI above 50 provides stronger bullish evidence. Always be cautious during choppy market conditions and avoid relying solely on this pattern.
- Lagging nature means delayed signals
- Whipsaws possible in range-bound markets
- Best confirmed with other technical tools
- Use stop-losses to manage risk
4. Golden cross vs. death cross: What’s the difference?
The Death Cross is the bearish counterpart to the Golden Cross. It occurs when the short-term moving average crosses below the long-term average, signaling a potential downtrend.

| Feature | Golden Cross | Death Cross |
|---|---|---|
| Direction | Bullish (uptrend) | Bearish (downtrend) |
| Signal | Short-term MA crosses above long-term MA | Short-term MA crosses below long-term MA |
| Market Sentiment | Positive | Negative |
Both signals are closely watched as major momentum shifts. For instance, the S&P 500’s 2008 Death Cross followed a major sell-off, warning of further losses. Understanding their differences helps traders balance bullish and bearish perspectives for better timing. This comparison clarifies what is a golden cross in trading versus its bearish counterpart.
5. Real-world examples of golden cross patterns
- S&P 500 (2009): The Golden Cross in April 2009 marked the start of a multi-year bull run after the financial crisis. Prices rose more than 150% in the following years.
- Bitcoin (2020): In May 2020, Bitcoin’s Golden Cross occurred amid growing institutional interest. The price climbed from around $8,800 to over $40,000 in the next 12 months. This illustrates how what is a golden cross in trading can play out in the crypto market.
- Forex – EUR/USD (2017): A Golden Cross on the daily chart in mid-2017 preceded a sustained uptrend, with the euro appreciating against the dollar by over 7% in the next quarter.
These examples show how the Golden Cross can signal strong market shifts but also highlight the importance of context and additional analysis.
Explore more trading insights:
6. Best practices for using the golden cross signal
- Confirm with other indicators: Use RSI, MACD, or volume to validate the signal.
- Set stop-loss orders: Protect your capital by defining clear exit points.
- Adjust moving average periods: Tailor to the asset’s volatility and the timeframe you trade.
- Don’t rely on a single indicator: Combine the Golden Cross with other analysis methods for better accuracy.
| Do’s | Don’ts |
|---|---|
| Use volume to confirm signals | Ignore risk management |
| Apply across timeframes | Blindly enter trades on every crossover |
| Combine with trend and momentum tools | Trade during high volatility without confirmation |
These guidelines increase the likelihood of successful trades while reducing exposure to false signals. For those looking at how to earn Bitcoins, combining golden cross with earning strategies adds diversification.
7. FAQs about what is a golden cross in trading
7.1 Can a Golden Cross fail?
Yes, especially in volatile or sideways markets, false signals can occur.
7.2 Which moving averages work best?
The standard is 50-day and 200-day, but traders may adjust based on asset and timeframe.
7.3 Is the Golden Cross suitable for beginners?
Yes, but beginners should combine it with other indicators and practice risk management.
7.4 How does volume affect the pattern?
Higher volume at crossover strengthens the signal’s reliability.
7.5 Should I use the Golden Cross alone or with other tools?
It’s best used with other indicators to confirm trends and reduce false signals.
8. Conclusion
What is a golden cross in trading? It’s a powerful technical indicator that signals bullish momentum.. It helps traders identify trend reversals and plan entry points more effectively. By combining it with volume, RSI, or MACD, you can filter out false signals and improve your decision-making.
Here’s a quick checklist to remember:
-
Look for the 50-day MA crossing above the 200-day MA.
-
Confirm with volume and trend indicators.
-
Set clear stop-loss and exit strategies.
-
Avoid trading in choppy markets without confirmation.
Don’t forget to follow the Trader & Trading category on Vietnam-UStrade to for the latest trading insights and chart strategies.
Have you used the golden cross before in your trading?
Let us know your thoughts or drop any questions below we’re happy to explore them with you.