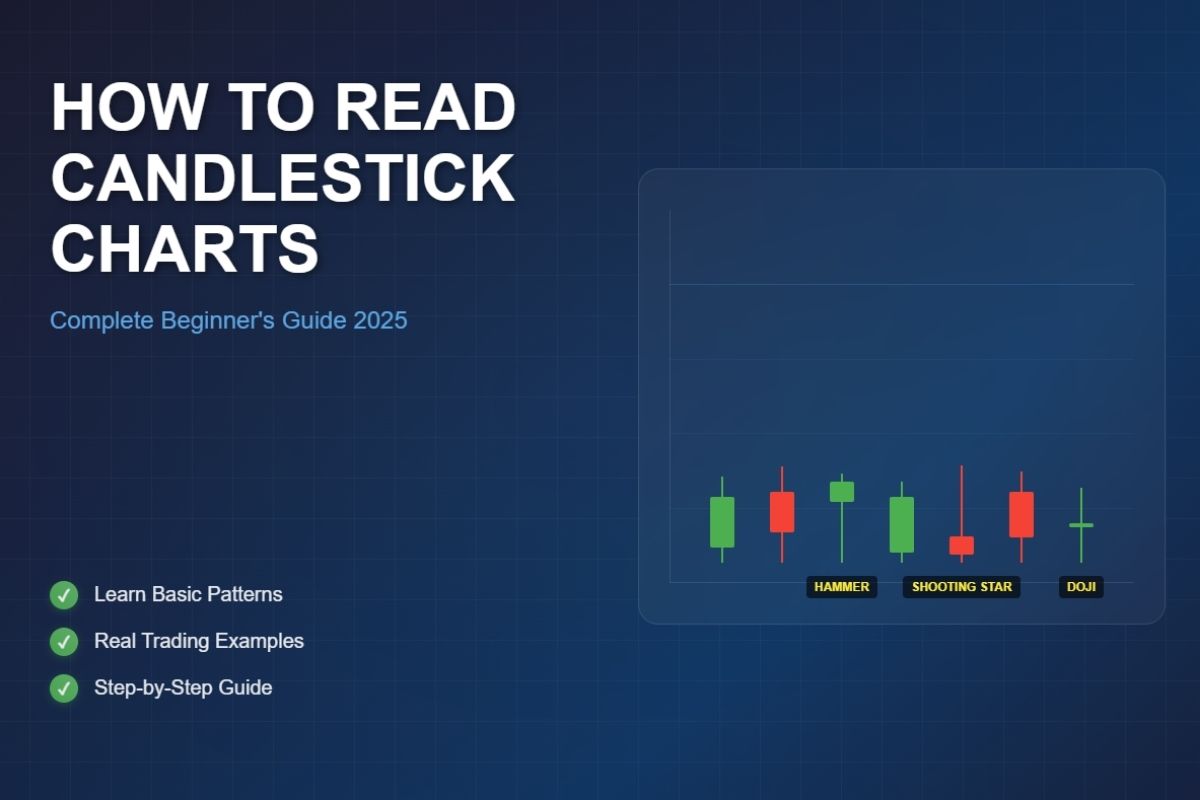
Learning how do you read a candlestick chart is fundamental for anyone entering financial markets. Candlestick charts are a popular way to visualize price movements in financial markets. Originating from Japan in the 18th century, they were initially created to track rice prices. Today, traders use them worldwide across stocks, forex, cryptocurrencies, and commodities to see market trends at a glance.
This guide aims to help absolute beginners understand how to read simple candlestick charts. Whether you follow Apple stock, Bitcoin, or Microsoft, a single candlestick shows the price action over a specific period, like a day or an hour. For traders in Vietnam and the US, understanding these charts can offer clearer decisions and better timing for trades.
By learning candlestick basics here, you’ll build a solid foundation to interpret market movements visually, making trading less intimidating and more approachable.
1. Understanding the Anatomy of a Candlestick
Each candlestick represents four price points within a trading period: the open, close, high, and low. The main part of the candle, called the “real body,” shows the range between the opening and closing prices. Thin lines above and below the body are “wicks” or “shadows,” indicating the highest and lowest prices reached during that time.
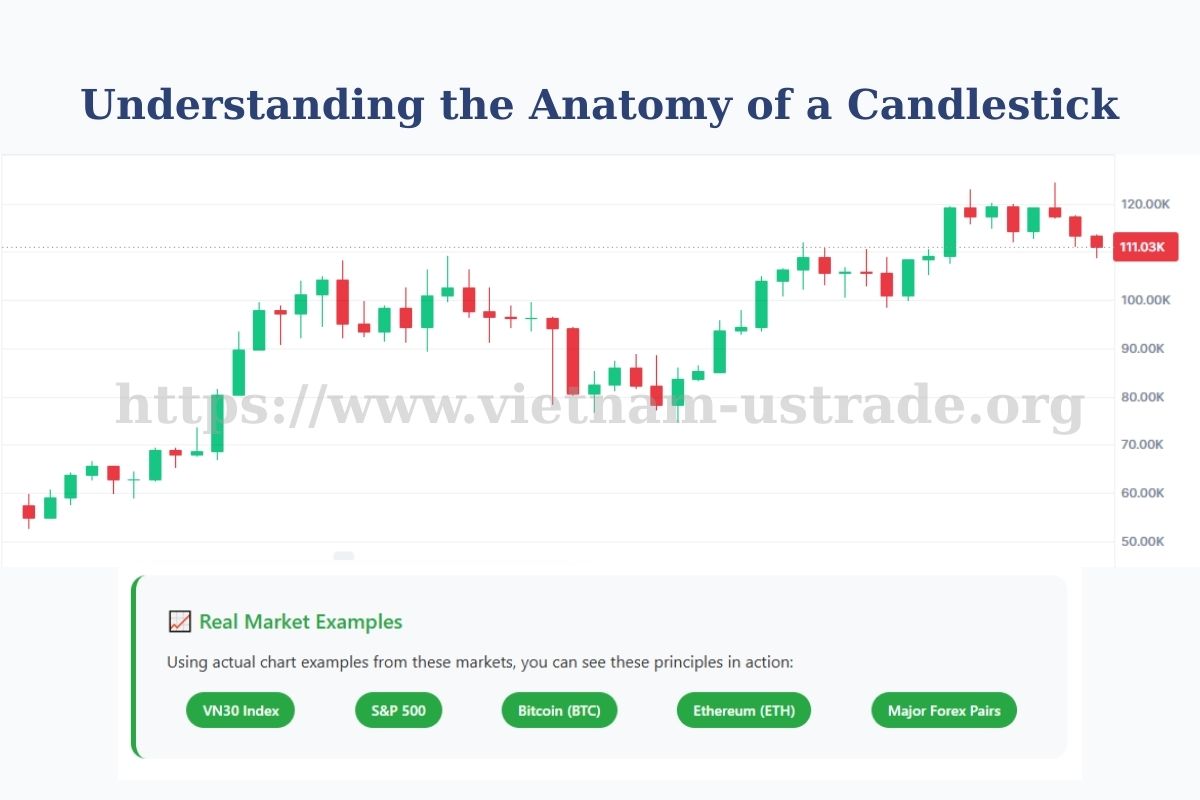
For example, a candlestick with a long wick on top and a short body suggests price reached high levels but closed near the open. Conversely, a long body with short wicks points to strong movement between open and close.
Understanding these parts helps you read price changes more meaningfully. Visual aids, like an illustrated candle showing labeled body and wicks, make spotting these patterns easier for new traders.
2. Candlestick Colors and What They Mean
Candlesticks typically come in two colors: bullish (green or white) and bearish (red or black). A bullish candle means the closing price is higher than the opening price, signaling buying pressure. A bearish candle shows the opposite, with the close below the open, indicating selling pressure.
Charting platforms might use different color schemes, but the key is to focus on the relationship between open and close prices rather than the color alone. For example, a green candle on a daily Bitcoin chart confirms price increased during that day.
Recognizing these colors helps you quickly identify market direction and prepares you for deeper analysis. Just like understanding what is a golden cross in trading, mastering color recognition in candlesticks provides crucial bullish and bearish signals.
Recognizing these colors helps you quickly identify market direction and prepares you for deeper analysis. Just like understanding what is a golden cross in trading, mastering color recognition in candlesticks provides crucial bullish and bearish signals. And as you progress, you might also wonder about the potential rewards from active trading for instance, how much can a day trader make. Exploring this will give you a clearer picture of how these technical skills can translate into real trading outcomes.
3. How Do You Read a Candlestick Chart? (Step-by-Step Guide)
Reading a candlestick chart is like telling a story about what happened during the trading period. Here’s how to interpret one candle:
- Step 1: Identify the candle’s color: Is it bullish (price went up) or bearish (price went down)?
- Step 2: Locate the open and close points (the body): Which side is higher? This shows who “won” the session—buyers or sellers.
- Step 3: Examine the wicks (shadows): How far did the price move beyond open and close? Long wicks can suggest volatility or rejection at certain price levels.
- Step 4: Judge the body length: A long body usually means a strong move, while a short body indicates indecision.
- Step 5: Tell the candle’s story: For example, a bullish candle with a long lower wick might mean buyers pushed the price up after sellers initially pushed it down.
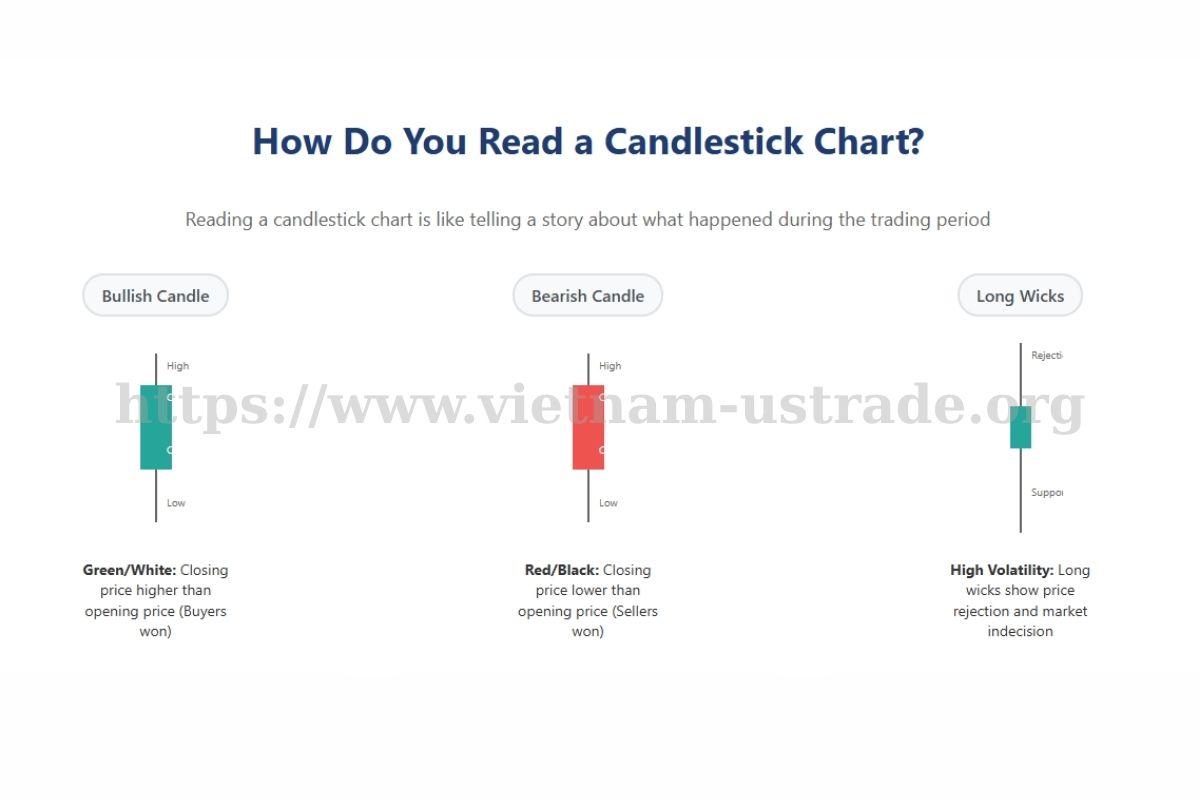
Using actual chart examples from VN30, S&P 500, or major cryptocurrencies in 2025, you can see these principles in action. Beginners should remember not to rely just on color but also check the timeframe and the chart axis to avoid mistakes.
4. What Do the Body and Wicks Reveal About Market Sentiment?
The shape of the candle reveals a battle between buyers and sellers.
- Long body: Indicates a strong trend, either upward or downward.
- Short body: Shows market indecision or balance.
- Long upper wick: Suggests buyers tried pushing prices higher but were pushed back by sellers.
- Long lower wick: Means sellers pushed prices down, but buyers regained control before close.
For example, the “hammer” candle has a small body with a long lower wick, signaling a potential reversal after selling pressure fades. These clues help traders gauge market sentiment.
5. Recognizing Basic Candlestick Patterns (for Beginners)
Patterns form when individual candles create specific shapes that indicate potential market moves. Here are important beginner patterns:
- Doji: Open and close are nearly the same, signaling indecision.
- Hammer: Small body, long lower wick; possible trend reversal upward.
- Shooting Star: Small body, long upper wick; may signal reversal downward.
- Bullish Engulfing: A large green candle fully covers the previous red candle, suggesting strong buying.
- Bearish Engulfing: A large red candle covers the previous green candle, indicating selling pressure.
- Morning Star: A three-candle pattern suggesting a bullish reversal.
- Spinning Top: Small body with long wicks; indecision in the market.
Patterns have more meaning when confirming trends and volumes exist. Real-world chart snippets show these patterns helping traders decide when to buy or sell. Understanding these patterns complements other technical analysis tools, similar to learning what’s the difference between futures and options for advanced trading strategies.
6. How to Apply Candlestick Analysis in Trading
To use candlestick charts effectively, try these steps:
- Step 1: Scan the chart for candles or patterns that stand out as signals.
- Step 2: Confirm these signals by looking at the overall trend and trading volume.
- Step 3: Compare candles across timeframes—for example, daily candles show longer-term moves, while 5-minute candles reveal short-term momentum.
- Step 4: Remember that individual candles can’t predict the market alone; use them alongside indicators like moving averages.
- Step 5: Beginners should avoid jumping to conclusions and start practicing with simulated trading before committing real money.
For instance, a hammer candle on Apple’s daily chart helped mark a swing low, suggesting a good entry point for buyers.
7. Real-World Bitcoin Trading Example with Candlestick Analysis
Let’s examine a concrete Bitcoin trading scenario from August 2025 to see candlestick analysis in action. On August 12, 2025, Bitcoin was trading at $118,500 when several bullish patterns emerged.
Pattern Recognition: A hammer candle appeared on August 10 at the $115,000 support level, followed by a bullish engulfing pattern on August 11. The engulfing candle completely covered the previous red candle, signaling strong buying pressure.
Trade Setup:
- Entry: $119,200 (breakout above engulfing pattern)
- Stop Loss: $115,800 (below hammer’s lower wick)
- Target: $123,000 (next resistance level)
- Risk/Reward: 1:2.5
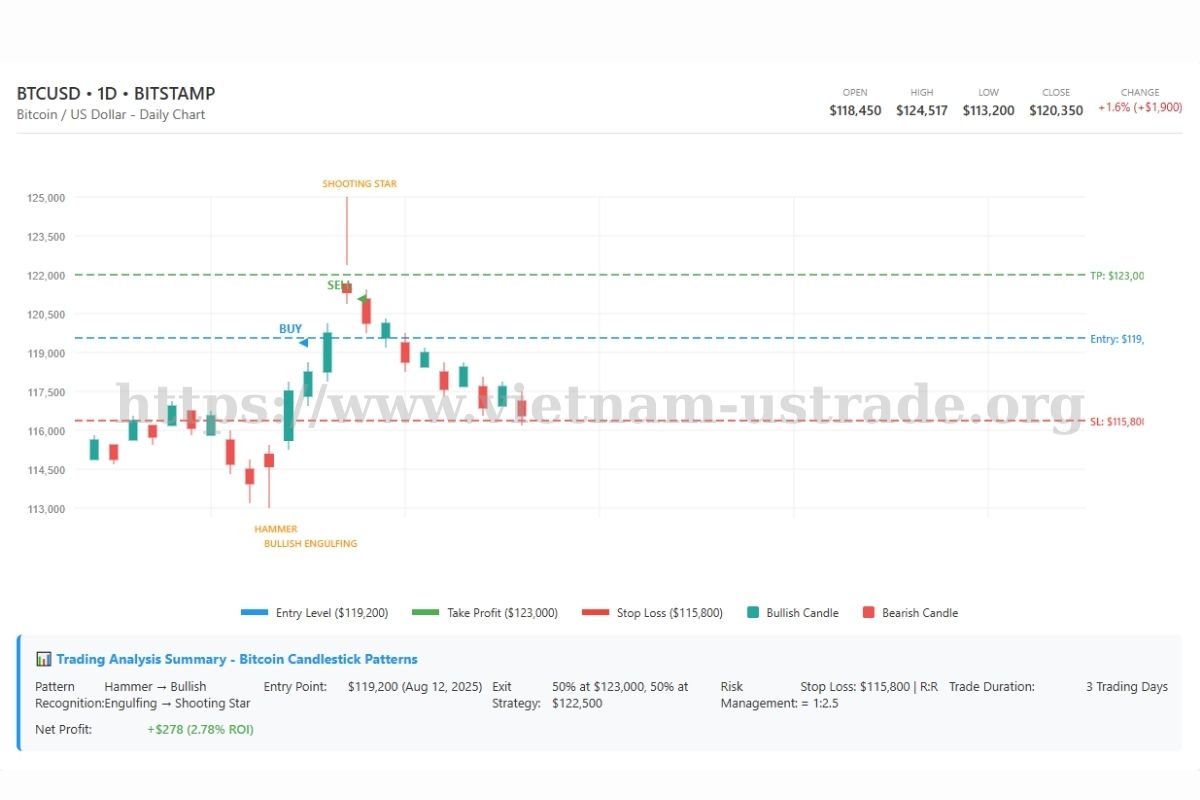
Market Action: Bitcoin surged to $121,800 on August 13, then hit a new high of $124,517 on August 14. However, a shooting star pattern with a long upper wick appeared at the peak, warning of potential reversal.
Trade Result: The trader closed 50% at $123,000 and the remainder at $122,500 when bearish signals emerged. With a $10,000 position, this generated approximately $278 net profit (2.78% return) over 3 days.
Key Takeaways: This example shows how combining multiple candlestick patterns with proper risk management can yield consistent profits. The hammer-engulfing combination provided a strong entry signal, while the shooting star warned of the reversal, allowing for timely exit. Remember, not every pattern leads to success, but disciplined application of candlestick analysis improves trading odds significantly.
8. Candlestick Charts vs. Other Chart Types
Candlestick charts differ from line, bar, or OHLC charts in how they present price data.
| Chart Type | Advantages | Disadvantages |
|---|---|---|
| Candlestick | Clear visual of open, close, high, low; quick sentiment read | Can overwhelm beginners with too much detail |
| Line | Simple, shows closing price trends clearly | No detail on high/low or session strength |
| Bar | Shows open, close, high, low like candlesticks | Less intuitive, can look cluttered |
| OHLC | Detailed price info in bar format | Less visually appealing; harder for quick mood assessment |
Choosing a chart depends on your trading style. Candlestick charts offer more depth but require practice to interpret efficiently.
9. Common Mistakes Beginners Make (and How to Avoid Them)
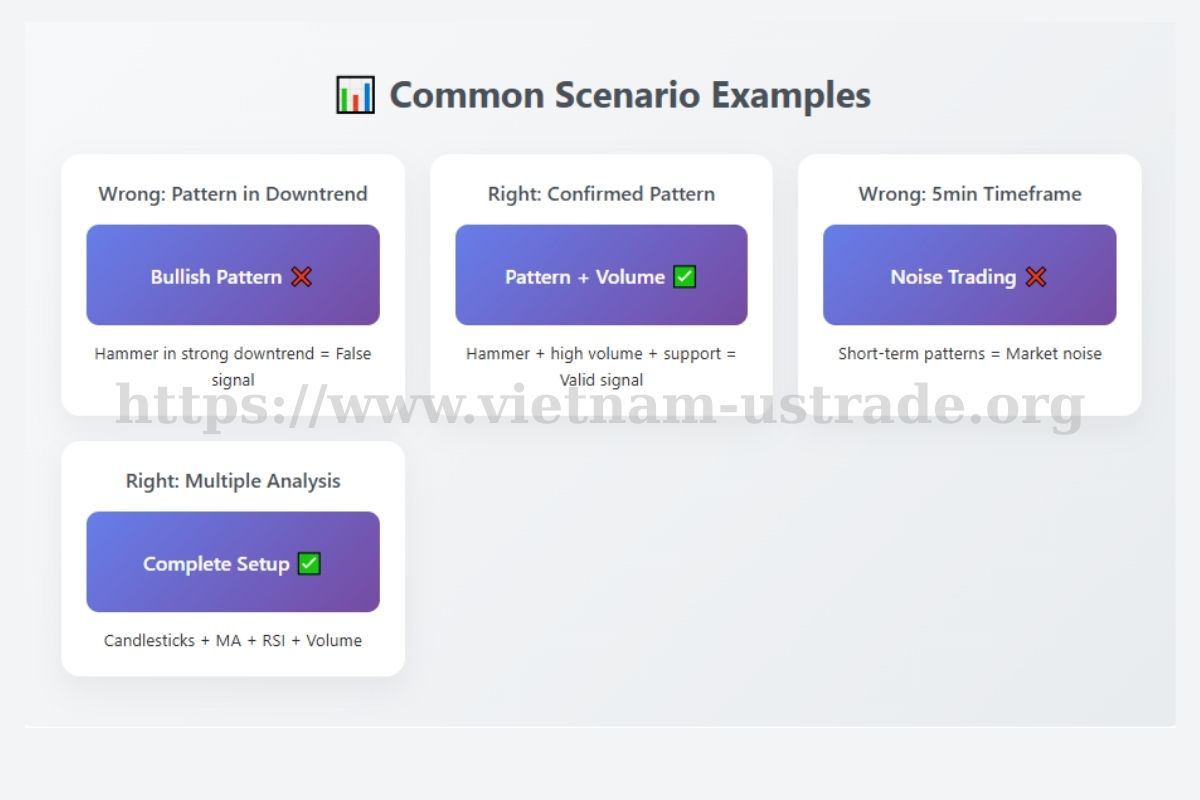
- Ignoring overall market trend — always check the bigger picture before acting. Pro tip: Use moving averages to confirm trend direction.
- Chasing every pattern — not all patterns lead to success. Pro tip: Wait for confirmation signals before trading.
- Not considering timeframe — patterns on short-term charts behave differently from daily charts. Pro tip: Match your trade style to the appropriate timeframe.
- Confirmation bias — seeing what you want, not what’s there. Pro tip: Stay objective; cross-check with volume and indicators.
- Over-relying on candlesticks alone — they are part of a bigger toolkit. Pro tip: Combine with other analysis methods.
Understanding what happens when call options expire in the money can also help you manage positions more effectively when combining options strategies with candlestick analysis.
10. FAQs About Reading Candlestick Charts
10.1. Can candlestick charts predict the market?
No, chart can predict with certainty. Candlesticks show past price action to help estimate likely moves.
10.2. What timeframe should I use?
It depends on your trading style. Day traders prefer short frames; investors look at daily or weekly.
10.3. Are candlestick colors always the same?
Colors vary by software, but the meaning depends on whether close is above or below open.
10.4. What if I’m colorblind—can I still read them?
Yes, focus on candle shape and position rather than color. Some platforms offer colorblind-friendly palettes.
10.5. Do candlestick charts work for crypto, forex, and stocks?
Yes, they are widely used because they show clear price action in all these markets.
11. Conclusion
Understanding how do you read a candlestick chart equips traders with a powerful visual tool to interpret market movements. By learning the anatomy, colors, and basic patterns, beginners can make more informed decisions whether trading stocks, forex, or cryptocurrencies.
Remember, candlesticks tell a story of buyers and sellers battling for control. Combining this insight with trend analysis and volume improves your chances of spotting trading opportunities. Start small, practice regularly, and use this guide to build your confidence in reading candlestick charts in 2025 and beyond.
Don’t forget to follow the Trader & Trading category on Vietnam-UStrade for more advanced technical analysis strategies and market insights to enhance your trading skills.

