Along with many useful indicators in investment like RSI, ADX, ATR… another equally important indicator is Bollinger Band. To know what Bollinger band is, its meaning, its drawbacks, and how to effectively use it, please follow the content below.
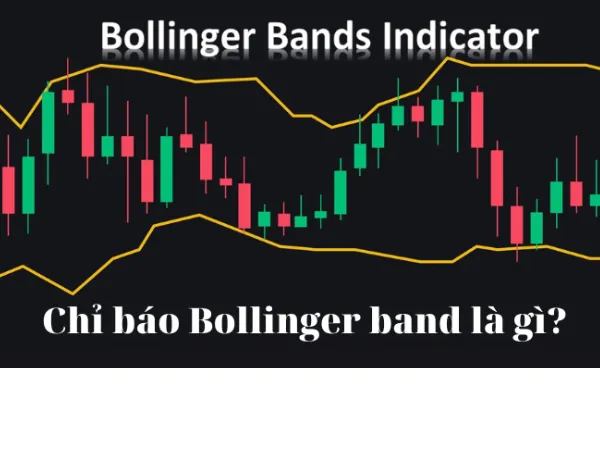
What is Bollinger Band?
Bollinger band is a technical indicator represented by a simple moving average SMA in the middle, with an upper and a lower band above and below. When the market is highly volatile, you will see the Bollinger bands widen, and conversely, when the market stabilizes, the bands will narrow. The Bollinger Band is named after its creator, John Bollinger.
The significance of Bollinger Bands
Bollinger bands are a popular indicator trusted by many investors for years.
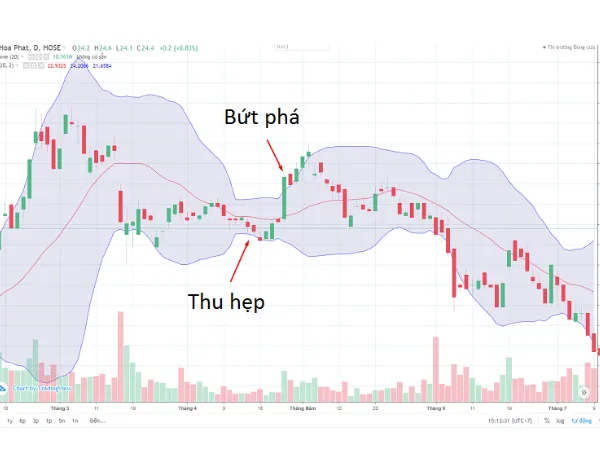
Congestion of Bollinger Band
Observe the narrowing of Bollinger Bands when the upper and lower bands approach the SMA. This is an important sign, indicating low volatility. Many believe this prepares for a strong price movement upcoming, offering trading opportunities when prices become more volatile. If the bands widen, it could signal a chance to exit a position. However, the narrowing or widening of the bands does not necessarily mean investment opportunities, as it does not reveal the direction of the price movement, whether up or down.
Breakouts
Most price movements happen within the range between the upper and lower bands. Therefore, any movement outside this range warrants attention. Of course, this is not a trading signal by itself, as it does not indicate the direction of movement. A common mistake traders make is believing that any break beyond the bands’ boundaries is a trading signal.
Disadvantages of Bollinger Band
Bollinger band is merely an indicator providing information about price volatility, and it is not a standalone trading network. The creator also advises users to combine it with other indicators for a more comprehensive market view. Some suggested indicators include MACD and RSI, because these are calculated directly from the SMA line, whereas Bollinger Bands use the average of old and new data, potentially overshadowing recent data.
How to effectively use Bollinger Bands?
Trading within the Bollinger Band range
Within the Bollinger Bands range, the upper band acts as resistance and the lower as support. According to the rule, any movement beyond these limits is a trading signal. However, this approach has limitations:
- Suitable during stable market conditions, with low profits.
- When prices move outside the bands, it signifies a new trend, rendering old position data irrelevant.
- When the bands widen, it indicates a new trend and significant volatility, meaning previous data may no longer be useful.
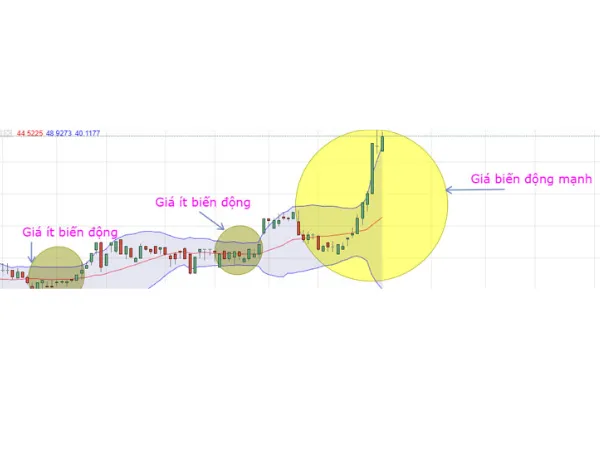
Trading during long-term sideways breakouts after Bollinger Bands consolidation
Trading in a sideways price trend involves minor, short-term fluctuations. The most appropriate moment is when the price breaks out above the upper or below the lower Bollinger Band. Traders can monitor and capitalize on these opportunities, but require careful timing as each breakout indicates a previous trend breakthrough, with adjustments needed after each event to open or close positions. Each breakout reveals a significant move in the prior trend.
The chart below illustrates NVL stock’s volatility, with a breakout signal occurring on 17/07 when the price breaks above the Bollinger Band, indicating a potential strong new trend, especially when combined with volume and breaking above MA20. Notice that during June and July, the bands narrowed, often a precursor to significant volatility. On September 5, a sell signal appeared as the price fell below the lower band.
Conclusion
This article provided you with fundamental knowledge about Bollinger Band indicator, including what it is, its significance, current limitations, and tips for effective use. Hopefully, you now understand more about this indicator and can employ it efficiently in your investment activities.
See also: Stochastic Indicator