With the development of binary trading platforms, various tools have been created to observe and predict market trends and asset directions, including the useful ATR indicator. So, what is the ATR indicator? How is this indicator used? All will be revealed in the sections below.
ATR (Average True Range) is an indicator that helps users make investment decisions in the Forex market. It has been known since 1978, originating from the book “New Concepts in Technical Trading Systems” by Welles Wilder. In this book, ATR is introduced as an indicator analyzing the intensity of volatility caused by price gaps or limited oscillation ranges.
Initially, when it was first developed, ATR could calculate the price up and down of a commodity within a given time period, possibly in each minute or daily. Today, ATR can be applied to all types of assets in the market, especially securities and Forex.
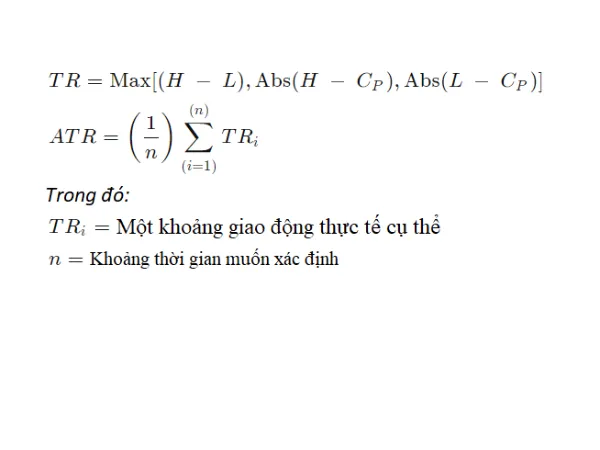
The maximum value of the true range ATR is represented through:
- The highest point at the current time minus the previous closing price
- The lowest point at the current time minus the previous closing price
- The current high minus the current low.
Sometimes, the result can be positive or negative. However, we only consider the absolute value of the highest.
Then, to calculate the average value over 14 recorded periods, users follow this formula.
ATR = [(Previous ATR x 13) + Current TR] / 14
In 1978, after Wilder mentioned the ATR, he saw a new enlightenment for the volatile trading market from this indicator. He began researching this index with a single purpose: to reflect the market through the ATR index to help investors easily make predictions about market upward or downward trends.
At this time, when the market experienced many fluctuations, price gaps could have large differences. The magnitude of the value is reflected through this indicator. The higher the indicator, the wider the oscillation amplitude, indicating that the market is experiencing sharp increases or decreases over a short period, and vice versa, the lower the ATR, the narrower the amplitude, indicating a sideways or range-bound market.
Hence, experienced traders can recognize which trend the market is following by this ATR indicator. It provides support in finding a safe entry point or a point to exit a trade. Usually, investors enter trades when the ATR is high. However, there are reverse cases where users prefer to enter when the market is sideways.
The ATR indicator is considered a useful tool by investors to determine the average range of oscillation, helping to find suitable stop-loss gaps. When ATR is high, traders place stop-loss orders farther from the current position, and vice versa.
Additionally, ATR allows users to recognize when the market is highly volatile or weak, or is ranging, which helps set appropriate stop-loss levels to avoid unnecessary losses. Proper stop-loss also helps maintain current profits.
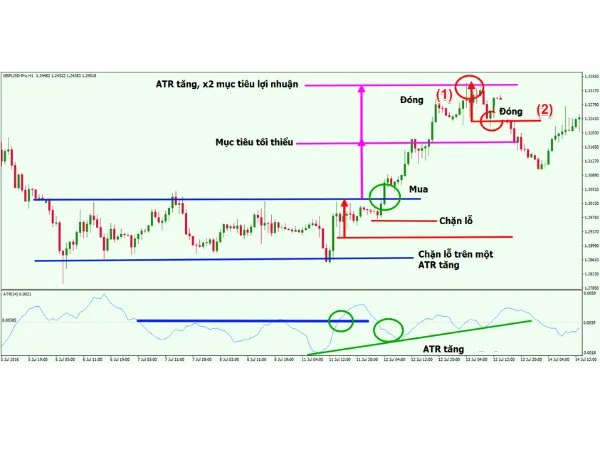
Besides identifying exit points, ATR also guides users on where to close positions amidst market volatility. If the indicator is in the upper half of the chart, you might aim for double profit if seeking high returns. Conversely, if in the lower half, smaller targets are advisable. This approach applies similarly to both bullish and bearish trends, called trend-following markets.
The example above features the EURUSD currency pair alongside its ATR chart below. Users can see the ATR sitting in the upper half of the price chart, indicated with red arrows. Correspondingly, the market shows high volatility. During significant fluctuation, ATR stays in the upper half, signaling traders to set wider stop-losses to preserve capital and prevent large losses in this financial trading environment.
This article has summarized all relevant information about the ATR index. Through this, you can answer the question: “What is ATR, and how does it assist in investing in stock and Forex markets?” The answer depends on you. We hope this article provides useful insights to support your current and future investment endeavors.
See more: ADX indicator