

The Japanese Candlestick Chart is an essential analysis tool that helps predict market price trends in finance generally, aiming to identify suitable entry points for profitable trading for investors.
Today, Japanese candlestick charts are widely used in markets such as Forex, stocks, and Crypto. However, not everyone truly understands this type of chart, especially beginners.
So, what is a Japanese Candlestick Chart? Let’s explore through the following article from vietnam-ustrade.org:
What is a Japanese Candlestick Chart?
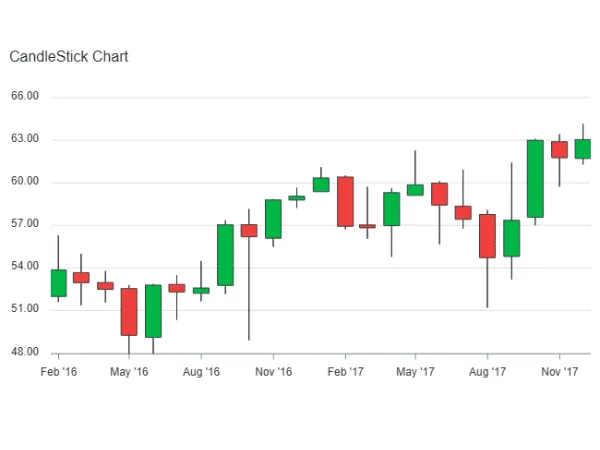
A Japanese candlestick chart is a type of price chart that shows price trends (high/low/sideways) and status (open/close) of specific Cryptos, Forex, or stocks over a certain period.
This chart type was invented centuries ago by a Japanese rice trader to monitor market price trends. Due to its practical application, the Japanese candlestick chart quickly spread and became popular in the United States and many other countries worldwide across various sectors.
In a Japanese candlestick chart, it usually consists of the body and the shadow, each serving specific functions as follows:
- Body: Helps identify the closing and opening prices relative to each other. If the closing price is shown in red or black, it means it is lower than the opening price. If the closing price is shown in green/white, it indicates it is higher than the opening price.
- Shadow: Helps identify the highest and lowest price points.
These parts of the candle act as “powerful assistants” for traders by visually displaying the price trend across different timeframes and market directions clearly.
Types of Candlestick Charts
Japanese candlestick charts are divided into four basic types, including:
Doji Candlestick Pattern
The Doji candlestick indicates indecision and tension in the market when the opening and closing prices of candles are nearly the same.
There are two types of Doji charts:
- Gravestone Doji
- Long-legged Doji
Bullish Engulfing and Bearish Engulfing
These are two contrasting candlestick patterns, specifically:
- Bullish Engulfing: Appears at the end of a downtrend, with a lower open and a higher close than the previous candle, indicating buying pressure.
- Bearish Engulfing: Indicates a new downtrend and dominance of selling pressure.
Hammer and Hanging-man
These are two candles with short bodies and long shadows, where:
- Hammer: Appears at the end of a downtrend
- Hanging-man: Appears at the end of an uptrend
Morning-star and Evening-star
These are two candles involving three candles, where:
- Morning-star: Indicates a new uptrend, consisting of 1 black/red candle and 2 white/green candles.
- Evening-star: Indicates a new downtrend, consisting of 1 black/red candle and 2 white/green candles.
Effective Ways to Read Candlestick Charts
Japanese candlestick charts are important tools with high applicability in market analysis. Understanding and skillfully analyzing these charts greatly benefit traders in their trading decisions. Reading Japanese candlestick charts is not too difficult, specifically:
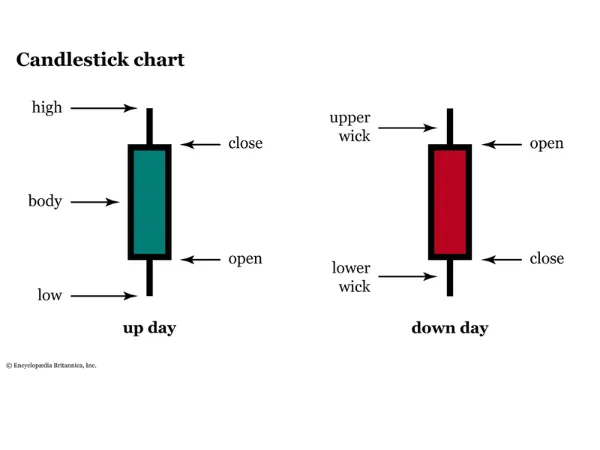
Depending on trader evaluation goals, one candle can represent one hour, one day, or one trading session. The two peaks of a candle reflect the opening and closing prices. When the body is red/black, the opening price is above the closing price; when the body is green/white, the closing price is above the opening price.
Body:
- The longer the body, the greater the difference between the opening and closing prices.
- A short body indicates a saturated market trend.
Shadow:
Long shadows imply strong buying/selling activity, often causing frequent price trend changes, showing a lively market. Traders should pay attention to the peak prices to consider and review resistance/support levels.
Overall, Japanese candlestick charts are very easy to read and analyze, but mastering this chart type is not simple.
Notes When Using Japanese Candlestick Charts
Although highly visual and easy to use, traders lacking proper understanding can easily make mistakes and suffer losses when trading based on candlestick charts. Specifically, if not carefully considering, reversal signals can be misinterpreted, leading to losses.
Even with clear signals in candlestick charts, investors should not rush into trading decisions. Combine other indicators and evaluate their correlations for a more confident, consistent decision-making process.
Especially, avoid trading based on single candles alone; focus on surrounding candles as well. To reduce risks, only trade in main trend directions. In all candlestick models, market confirmation signals are the most important.
In conclusion, although Japanese candlestick charts are easy to read, the variety of types, reading methods, and classifications can be challenging for traders. Mastery of these charts requires persistent learning. Besides relying on Japanese candlestick charts and other indicators for analysis, investors should keep calm, patient, and psychologically resilient to minimize risks and maximize profits.
Conclusion
This article on “What is a Japanese Candlestick Chart? Beginner’s trading experience” hopes to provide you with useful information. Wishing you success!


