The MACD indicator is a useful and easy-to-use tool in technical analysis within the forex market. If you are a seasoned investor, you are probably very familiar with the name MACD, but if you are a beginner, this article will help you get acquainted with MACD, including what MACD is, how to use MACD effectively, and important notes when using it.
What is MACD?
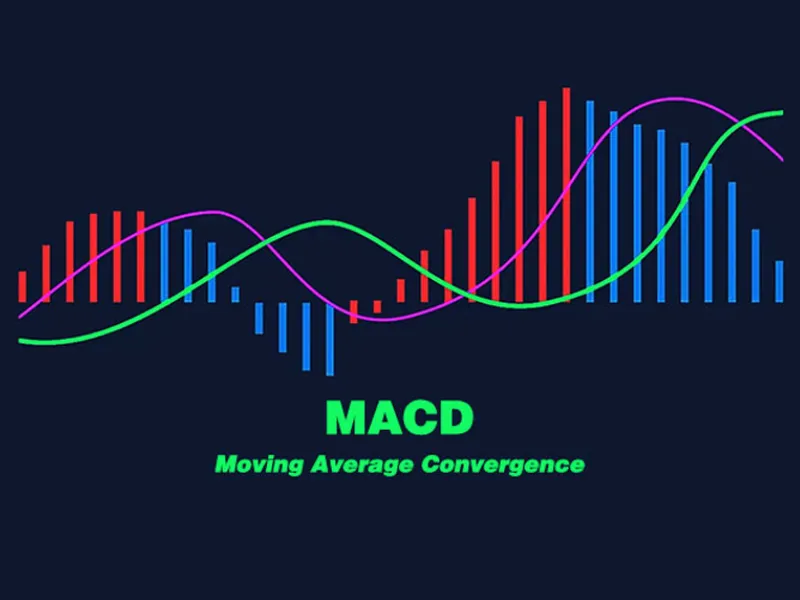
MACD is a popular and important indicator tool in forex trading
Moving Average Convergence Divergence (abbreviated as MACD) is a tool that indicates average change levels representing a new trend, which can be a downward or upward trend.
Many traders favor using this indicator to the extent of ‘loving’ it. On the MACD chart, you will see three types of parameters displayed on the technical screen:
First, the period parameter used to calculate the fast moving average (also called Fast EMA).
Second, the period parameter for the slow moving average (or Slow EMA).
Third, the number of bars used to calculate the difference between the fast and slow moving averages, known as the MACD SMA.
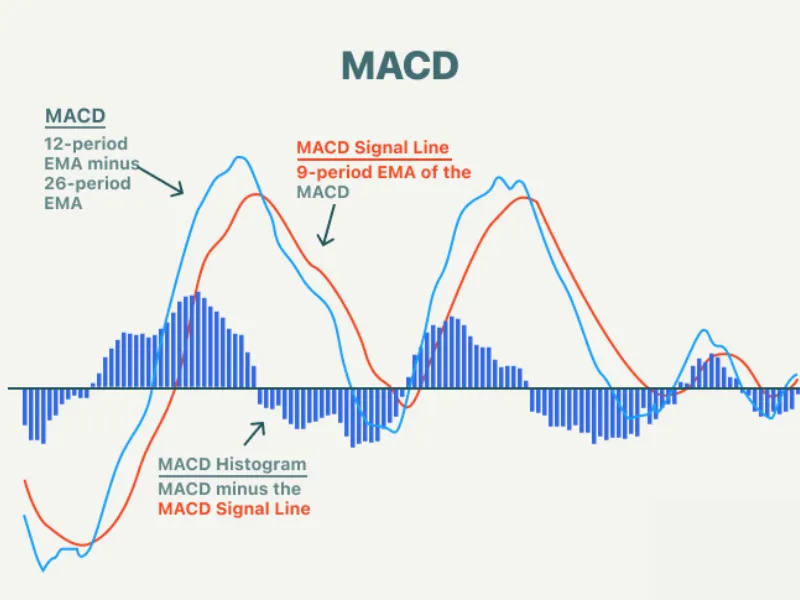
Observing the image above, the fast moving average line represents the changing average of the difference between the 12 and 26 moving averages.
The bar chart depicts the difference between the fast and slow moving averages. If the two averages move farther apart, the columns will get higher, and vice versa.
The divergence occurs when the faster changing average tends to pull away from the slower one.
Conversely, convergence is shown when the moving averages move closer together, and the frequency histogram will decrease.
Thus, we understand why this indicator is called “Moving Average Convergence Divergence” — Trung bình biến đổi phân kỳ hội tụ.
How to use MACD effectively
One thing to note is that because there are two moving averages with different speeds, during market fluctuations, the Fast EMA will change more quickly compared to the Slow EMA.
Similarly, when a new trend begins, the Fast EMA will show signs first and faster than the Slow EMA. The crossover phenomenon appears when the two lines meet; the Fast EMA starts diverging from the Slow EMA, indicating a new trend formation.
Buy signals:
+ It is known that a buy signal appears when the MACD line is above the signal line.
+ When the MACD frequency histogram is below the horizontal axis and begins to move towards it.
+ When a divergence occurs between price and MACD line. This means the price tends to decrease with lower lows, while MACD increases with higher lows.
For sell signals:
+ It is known that a sell signal occurs when the MACD line is below the signal line.
+ If the MACD histogram is above the horizontal axis and starts converging towards it.
+ When divergence occurs between price and MACD line. The price continues to rise while MACD declines.
Important notes when using MACD indicator
The MACD indicator can also produce false signals similar to other indicators. For example, a false bullish signal may occur when crossover happens in an upward direction, but the price drops sharply afterward. Similarly, a false bearish signal may occur when crossover happens downward, but the price continues to rise.
It is necessary to combine multiple indicators and various methods to avoid false signals and confirm genuine ones.
Conclusion
In summary, the MACD indicator is a highly useful and accurate tool, which is why many investors favor it so much. This article has explained what MACD is, how to use MACD, and some important points to note while using it. Hopefully, you have gained useful information for your investment tasks. Finally, Vietnam – ustrade.org wishes you success.