
RSI is an invention of J.Welles Wilder from 1978, and is a familiar indicator for many forex investors, especially those who favor technical analysis. This article will provide you with basic knowledge about RSI, including what RSI is, the meanings of the RSI indicator, how to use it effectively, and points to note.
What is RSI?
The RSI indicator tool (RSI stands for Relative Strength Index) helps users understand the relative strength of a particular product (Oil, Gold, etc.), to comment on overbought or oversold conditions at the same price level of a financial account or a stock.
The Relative Strength Index also functions to measure volatility within upper and lower boundaries ranging from 0-100, known as overbought and oversold regions, with the average line at 50.
Other meanings of the RSI indicator tool
Besides its role in identifying buy and sell signals like other indicators, RSI has some other functions such as:
- Identifying future price trends:
RSI can indicate future trends in two ways:
1. Upward trend indication occurs if the RSI line exceeds 50 or stays within the 45-55 range, and moves upward past the 55 level, signaling a potential bullish trend.
2. Downward trend indication occurs if the RSI line surpasses the 50 mark or stays within 45-55, but then drops below 45, indicating a potential bearish trend.
- Identifying divergence or convergence of price:
Much like the MACD indicator, RSI identifies trend changes through analyzing divergence or convergence of the price:
If divergence exists between RSI and price, it signals the end of a trend, indicating a shift from upward to downward or vice versa.
Conversely, convergence suggests the end of a trend, with the price shifting from down to up.
How to effectively use the RSI indicator
Here are some suggested methods for using RSI for investors to consider:
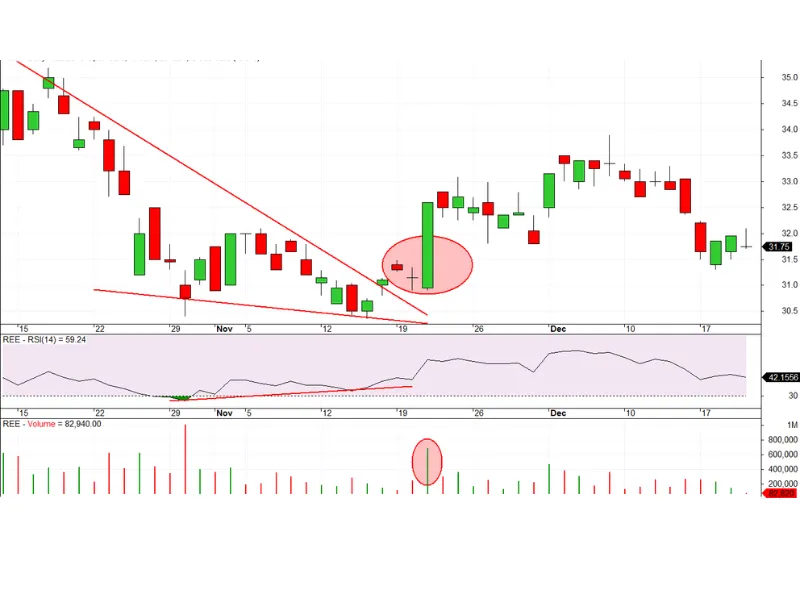
Basic RSI trading:
Focus mainly on the overbought and oversold levels of RSI and analyze to generate trading signals in these zones.
For example, when RSI drops below 30 (oversold region) and then rises back up, consider a buy order, especially if the price increases to previous high levels.
Similarly, when RSI goes above 70 (overbought region) and then drops back, consider a sell order, as the price declines below previous lows.
For a clearer understanding, observe the chart below:
- Using RSI indicator through divergence
This method is popular among many investors, signaling potential trend reversals.
To determine if the change is from bullish to bearish or vice versa, consider the following characteristics:
- If changing from a downtrend to an uptrend:
+ The price’s lows are lower than previous lows.
+ The RSI’s lows are higher than previous lows.
- If changing from an uptrend to a downtrend:
+ The price’s highs are higher than previous highs.
+ The RSI’s highs are lower than previous highs.
Observe the following chart for clarification:
Points to note during use
In summary, when deciding to use a technical indicator, investors must accept certain risks and shortcomings associated with technical indicators in general, and RSI in particular.
Key points to note when using RSI:
+ RSI only provides TECHNICAL PREDICTIONS, not guarantees of trend reversals.
+ All indicators have some margin of error; RSI is no exception.
+ When the price reaches overbought (>70) or oversold (
+ When a reversal occurs, the duration and intensity of the trend change depend on the trading timeframe. Different timeframes use different RSI parameters. Therefore, it is incorrect to assume an oversold or overbought RSI indicates an imminent reversal.
Finally, to generate accurate buy or sell signals, it is essential to combine multiple indicators for a synergistic effect to make the most informed decision.
Conclusion
The above article provides basic information about RSI, including: what RSI is, the significance of the RSI indicator, how to use RSI effectively, and points to note during use. Hopefully, this information meets your needs and can assist in your work.